Evaluating image segmentation models.
When evaluating a standard machine learning model, we usually classify our predictions into four categories: true positives, false positives, true negatives, and false negatives. However, for the dense prediction task of image segmentation, it's not immediately clear what counts as a "true positive" and, more generally, how we can evaluate our predictions. In this post, I'll discuss common methods for evaluating both semantic and instance segmentation techniques.
Semantic segmentation
Recall that the task of semantic segmentation is simply to predict the class of each pixel in an image.
Our prediction output shape matches the input's spatial resolution (width and height) with a channel depth equivalent to the number of possible classes to be predicted. Each channel consists of a binary mask which labels areas where a specific class is present.
Intersection over Union
The Intersection over Union (IoU) metric, also referred to as the Jaccard index, is essentially a method to quantify the percent overlap between the target mask and our prediction output. This metric is closely related to the Dice coefficient which is often used as a loss function during training.
Quite simply, the IoU metric measures the number of pixels common between the target and prediction masks divided by the total number of pixels present across both masks.
$$ IoU = \frac{{target \cap prediction}}{{target \cup prediction}} $$
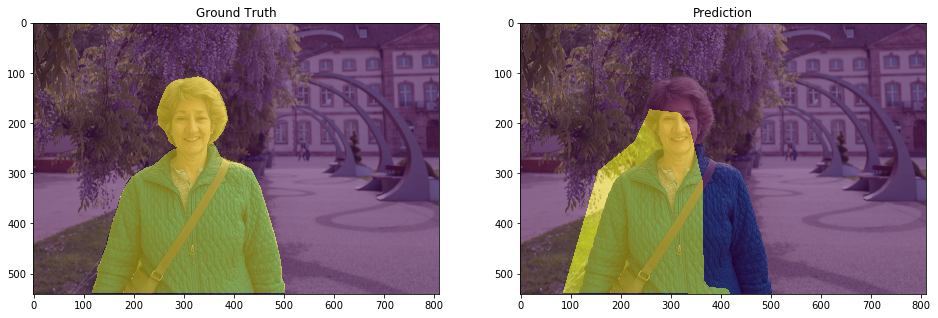
As a visual example, let's suppose we're tasked with calculating the IoU score of the following prediction, given the ground truth labeled mask.

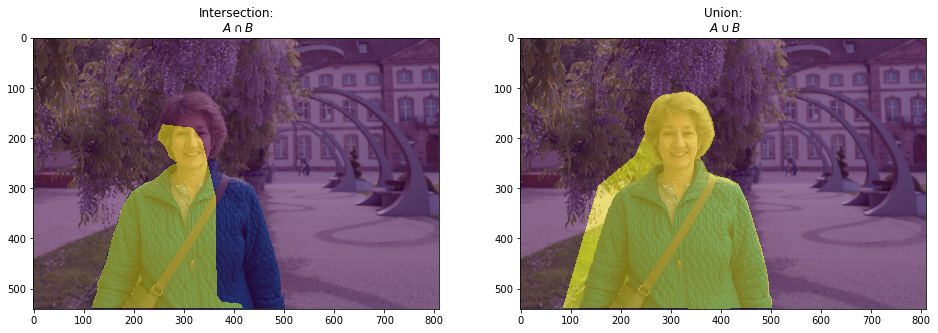
The intersection ($A \cap B$) is comprised of the pixels found in both the prediction mask and the ground truth mask, whereas the union ($A \cup B$) is simply comprised of all pixels found in either the prediction or target mask.

We can calculate this easily using Numpy.
intersection = np.logical_and(target, prediction)
union = np.logical_or(target, prediction)
iou_score = np.sum(intersection) / np.sum(union)
The IoU score is calculated for each class separately and then averaged over all classes to provide a global, mean IoU score of our semantic segmentation prediction.
Pixel Accuracy
An alternative metric to evaluate a semantic segmentation is to simply report the percent of pixels in the image which were correctly classified. The pixel accuracy is commonly reported for each class separately as well as globally across all classes.
When considering the per-class pixel accuracy we're essentially evaluating a binary mask; a true positive represents a pixel that is correctly predicted to belong to the given class (according to the target mask) whereas a true negative represents a pixel that is correctly identified as not belonging to the given class.
$$ accuracy = \frac{{TP + TN}}{{TP + TN + FP + FN}} $$
This metric can sometimes provide misleading results when the class representation is small within the image, as the measure will be biased in mainly reporting how well you identify negative case (ie. where the class is not present).
Instance segmentation
Instance segmentation models are a little more complicated to evaluate; whereas semantic segmentation models output a single segmentation mask, instance segmentation models produce a collection of local segmentation masks describing each object detected in the image. As such, evaluation methods for instance segmentation are quite similar to that of object detection, with the exception that we now calculate IoU of masks instead of bounding boxes.
Calculating Precision
To evaluate our collection of predicted masks, we'll compare each of our predicted masks with each of the available target masks for a given input.
-
A true positive is observed when a prediction-target mask pair has an IoU score which exceeds some predefined threshold.
-
A false positive indicates a predicted object mask had no associated ground truth object mask.
-
A false negative indicates a ground truth object mask had no associated predicted object mask.
Precision effectively describes the purity of our positive detections relative to the ground truth. Of all of the objects that we predicted in a given image, how many of those objects actually had a matching ground truth annotation?
$$ Precision = \frac{TP}{TP + FP} $$
Recall effectively describes the completeness of our positive predictions relative to the ground truth. Of all of the objected annotated in our ground truth, how many did we capture as positive predictions?
$$ Recall = \frac{TP}{TP + FN} $$
However, in order to calculate the prediction and recall of a model output, we'll need to define what constitutes a positive detection. To do this, we'll calculate the IoU score between each (prediction, target) mask pair and then determine which mask pairs have an IoU score exceeding a defined threshold value.
However, computing a single precision and recall score at the specified IoU threshold does not adequately describe the behavior of our model's full precision-recall curve. Instead, we can use average precision to effectively integrate the area under a precision-recall curve.
Let's use the precision-recall curve below as an example.
First, we'll adjust our curve such that the precision at a given point $r$ is adjusted to the maximum precision for recall greater than $r$.
Then, we'll simply calculate the area under the curve by numerical integration. This method replaces an older approach of averaging over a range of recall values.
Note that the precision-recall curve will likely not extend out to perfect recall due to our prediction thresholding according to each mask IoU.
As an example, the Microsoft COCO challenge's primary metric for the detection task evaluates the average precision score using IoU thresholds ranging from 0.5 to 0.95 (in 0.05 increments).
For prediction problems with multiple classes of objects, this value is then averaged over all of the classes.

